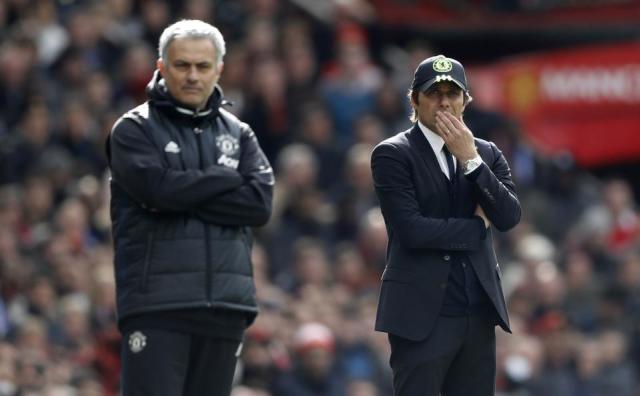
Antonio Conte says lifting the Premier League trophy with Chelsea would be more satisfying knowing his team had spent less than Manchester United and City this season.
“I think this season it’s very important to understand that it’s not always who spends more money who wins,” Conte said, as quoted by The Times. “Otherwise, in this league, this season the name of the team wasn’t Chelsea or Tottenham or Arsenal or Liverpool. You understand?”
The Italian, who took over at Stamford Bridge in the summer, was referring to the outgoings at Old Trafford and the Etihad Stadium during last summer. “You’ve seen the past,” Conte added. “You can see that every season they spend a lot of money. This season isn’t the only season the Manchester clubs have spent a lot of money. It’s normal. It’s right for them to do this, to reinforce their teams, if they think this is the right way to win the title.”
But is he right? Here, Newsweek looks at how the top five clubs in the Premier League compared in spending over the last three seasons:
1. Chelsea — 75 points
2016-17
Outgoing—£113 million ($145 million) Incoming — £90 million ($115 million) Net spend — £23 million deficit ($29 million)
2015-16
Outgoing — £77 million ($98 million) Incoming — £74 million (95 million) Net spend—£3 million deficit ($3.8 million)
2014-15
Outgoing — £117 million ($150 million) Incoming — £124 million (159 million) Net spend — £7 million profit ($9 million)
2. Tottenham Hotspur — 71 points
2016-17
Outgoing—£70 million ($90 million) Incoming — £45 million (58 million) Net spend — £25 million deficit ($32 million)
2015-16
Outgoing — £48 million ($62 million) Incoming — £59 million ($76 million) Net spend—£11 million profit ($14 million)
2014-15
Outgoing — £32 million ($41 million) Incoming — £38 million ($49 million) Net spend — £6 million profit ($7.7 million)
3. Liverpool — 66 points
2016-17
Outgoing—£68 million ($87 million) Incoming — £80 million ($102 million) Net spend — £12 million profit ($15 million)
2015-16
Outgoing — £89 million ($114 million) Incoming — £65 million ($83 million) Net spend—£24 million deficit ($31 million)
2014-15
Outgoing — £162 million (208 million) Incoming — £83 million ($106 million) Net spend — £79 million deficit ($101 million)
4. Manchester City — 64 points
2016-17
Outgoing—£144 million ($184 million) Incoming — £4 million ($5.1 million) Net spend — £140 million deficit ($179 million)
2015-16
Outgoing — £175 million ($224 million) Incoming — £32 million ($41 million) Net spend—£143 million deficit ($183 million)
2014-15
Outgoing — £81 million ($103 million) Incoming — £46 million ($59 million) Net spend — £35 million deficit ($45 million)
5. Manchester United — 63 points
2016-17
Outgoing—£157 million ($201 million) Incoming — £40 million ($51 million) Net spend — £117 million deficit ($150 million)
2015-16
Outgoing — £132 million ($169 million) Incoming — £86 million ($110 million) Net spend—£46 million deficit ($59 million)
2014-15
Outgoing — £170 million ($218 million) Incoming — £25 million ($32 million) Net spend — £145 million deficit ($186 million)
*All transfer figures accumulated from transfermarkt.co.uk


